Add a metric
Type /, choose Metric and pick one from the library, or press Build your own. The picker is the same as on a dashboard: see Add metrics from the library.
Metrics in a report are live: the numbers are current whenever someone opens it. Drag the bar under a chart to change its height, or double-click the bar to fit the chart to its contents.
A metric’s menu has Filters, to give it its own period or filters, and Remove from report.
Put things side by side
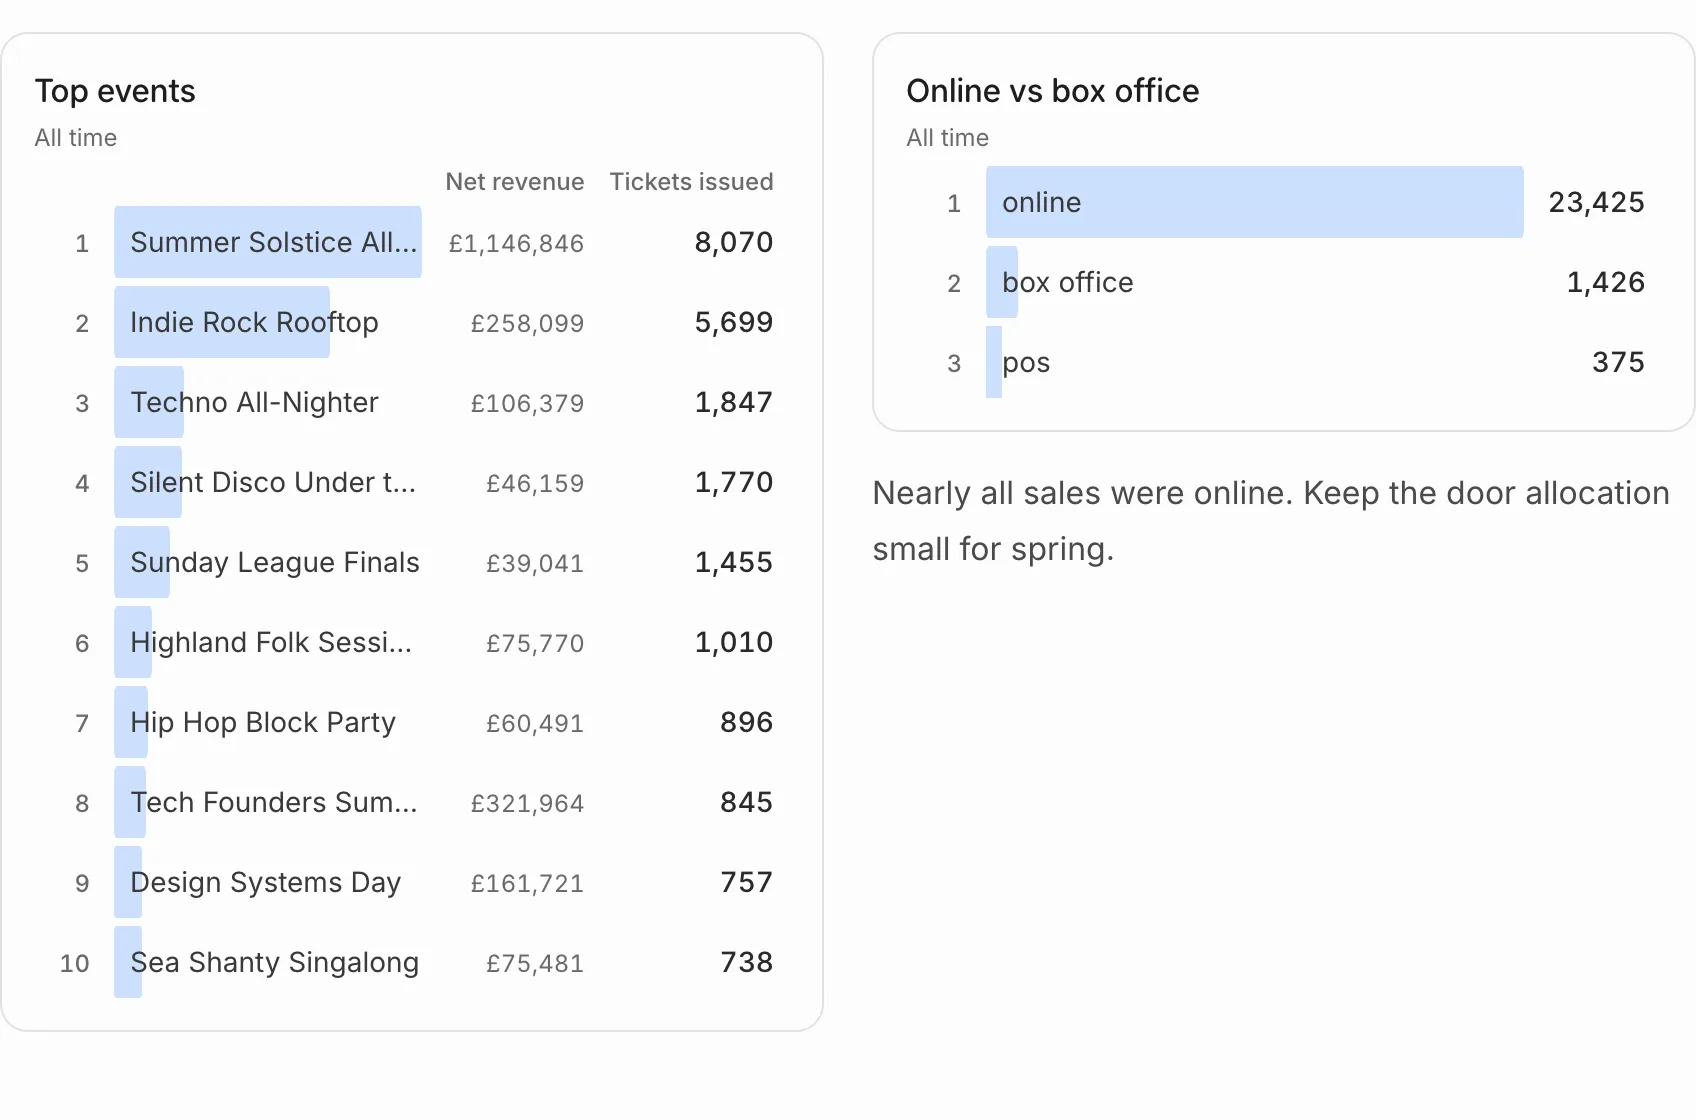
Choose 2 columns or 3 columns, then click into a column and type / to fill it. A column can hold metrics, text or anything else.
Add a table of rows
Choose Data table and pick a table from your ticketing platform, such as orders or check-ins. The report shows its first rows, kept up to date.
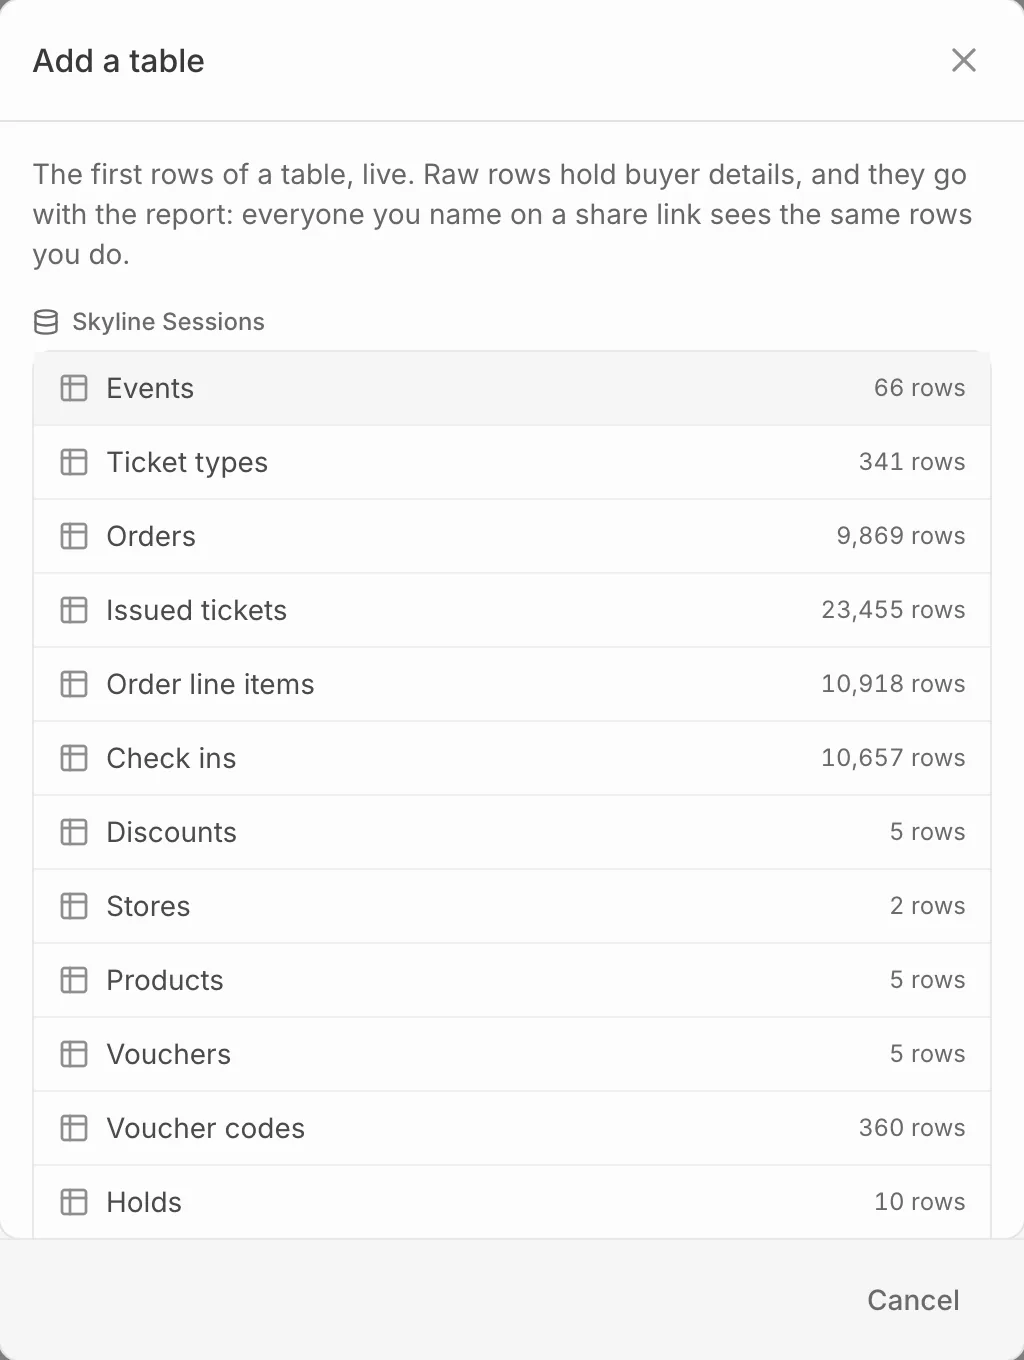
In a PDF, a table shows as many columns as fit the page and says how many it left out.
Set the period for the whole report
Press Filters at the top of the report, or F, to set a Period, an Event, a Source or other filters for every metric in it. They work as they do on a dashboard: see Filter a dashboard.