Create one
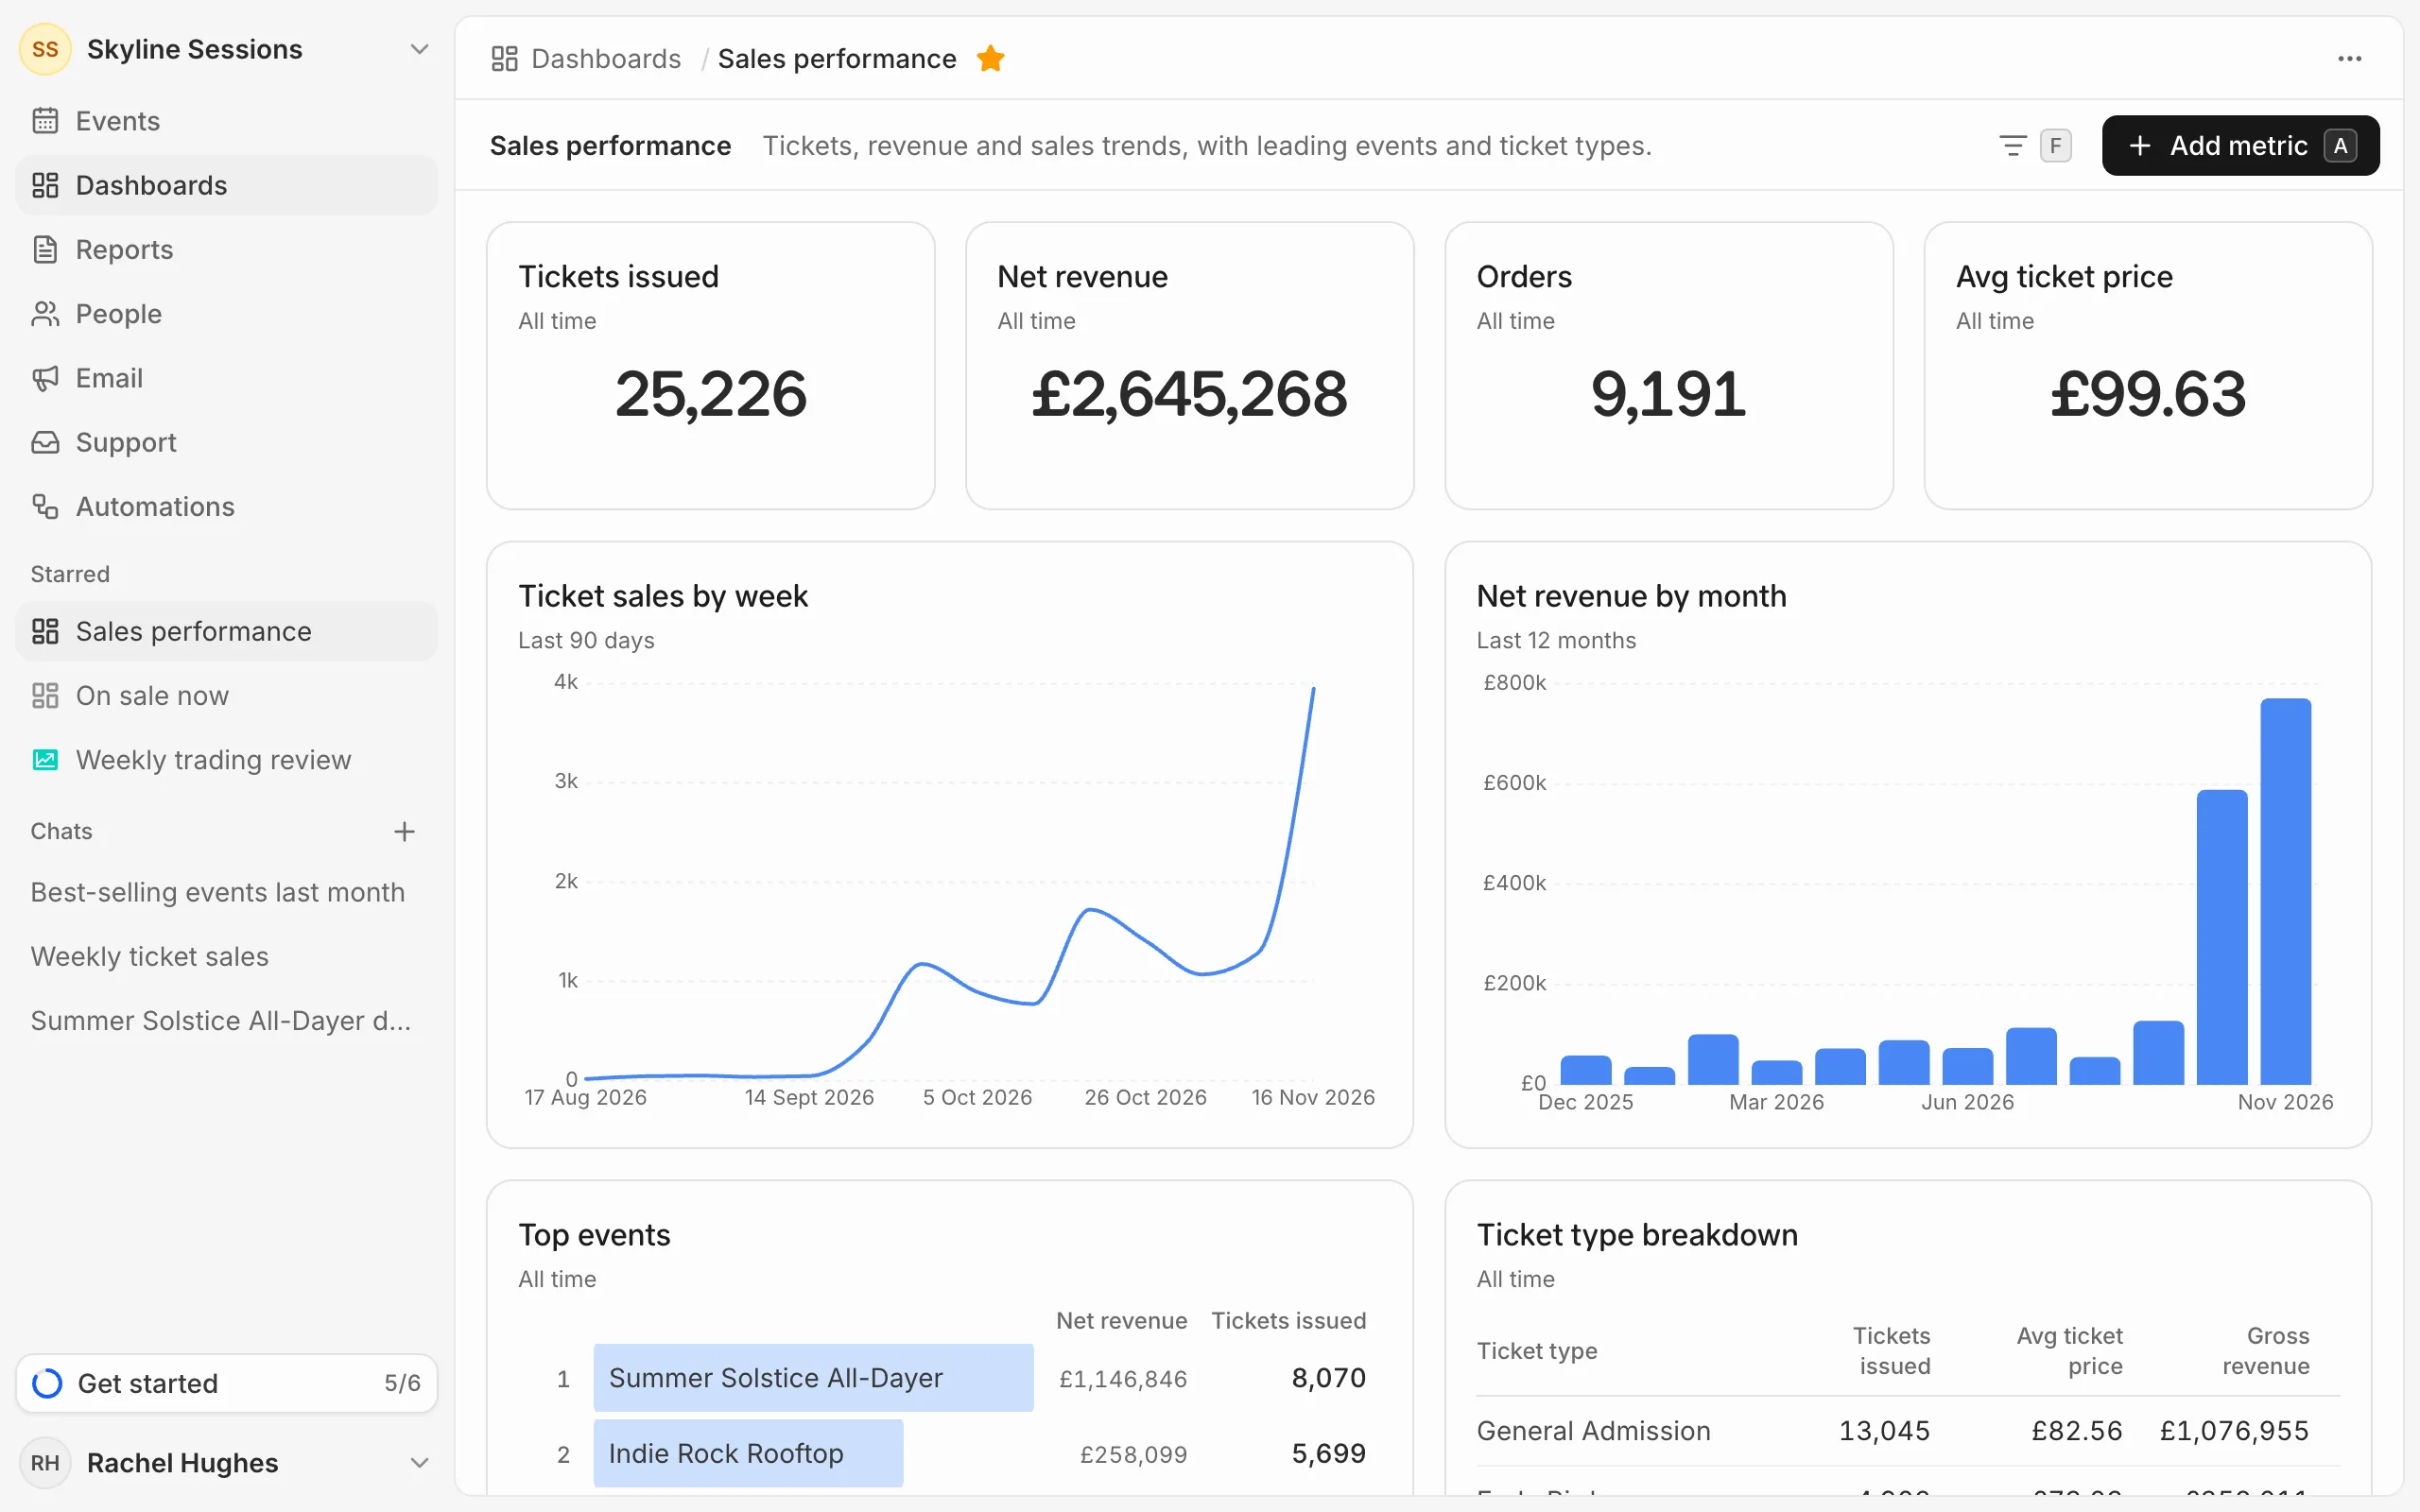
Open Dashboards in the sidebar and press New dashboard, or N. Click its name or Add a description at the top to change them.
To start from a dashboard you already have, open it and choose Duplicate from the … menu. The AI assistant can also build one for you: see Save answers to dashboards and reports.
Add metrics
Press Add metric, or A, and pick one from the library, or build your own. See Add metrics from the library and Build your own metric.
Lay it out
Drag a card to move it, and drag its bottom-right corner to resize it. The other cards move out of the way, and the layout saves as you go.
Change or remove a card
Hover over a card and open its menu:
- Edit opens a metric you built in the builder. Library metrics are kept up to date by Eventdash and can’t be edited.
- Filters sets this card’s own period, source or filters. See Filter a dashboard.
- Save to your metrics keeps a metric you built in your library, so you can add it to other dashboards and reports.
- Remove takes the card off this dashboard.
Show it on a screen
Choose Fullscreen from the … menu, or press Shift F, to hide the sidebar and give the cards the whole window. Press Esc to leave it.
Share it
Everyone in your organisation can open and change every dashboard. Dashboards can’t be shared outside your team: put the figures in a report and share the report instead.