Open the builder
On a dashboard, press Add metric, then Build your own. The chart on the left redraws as you change the definition on the right.
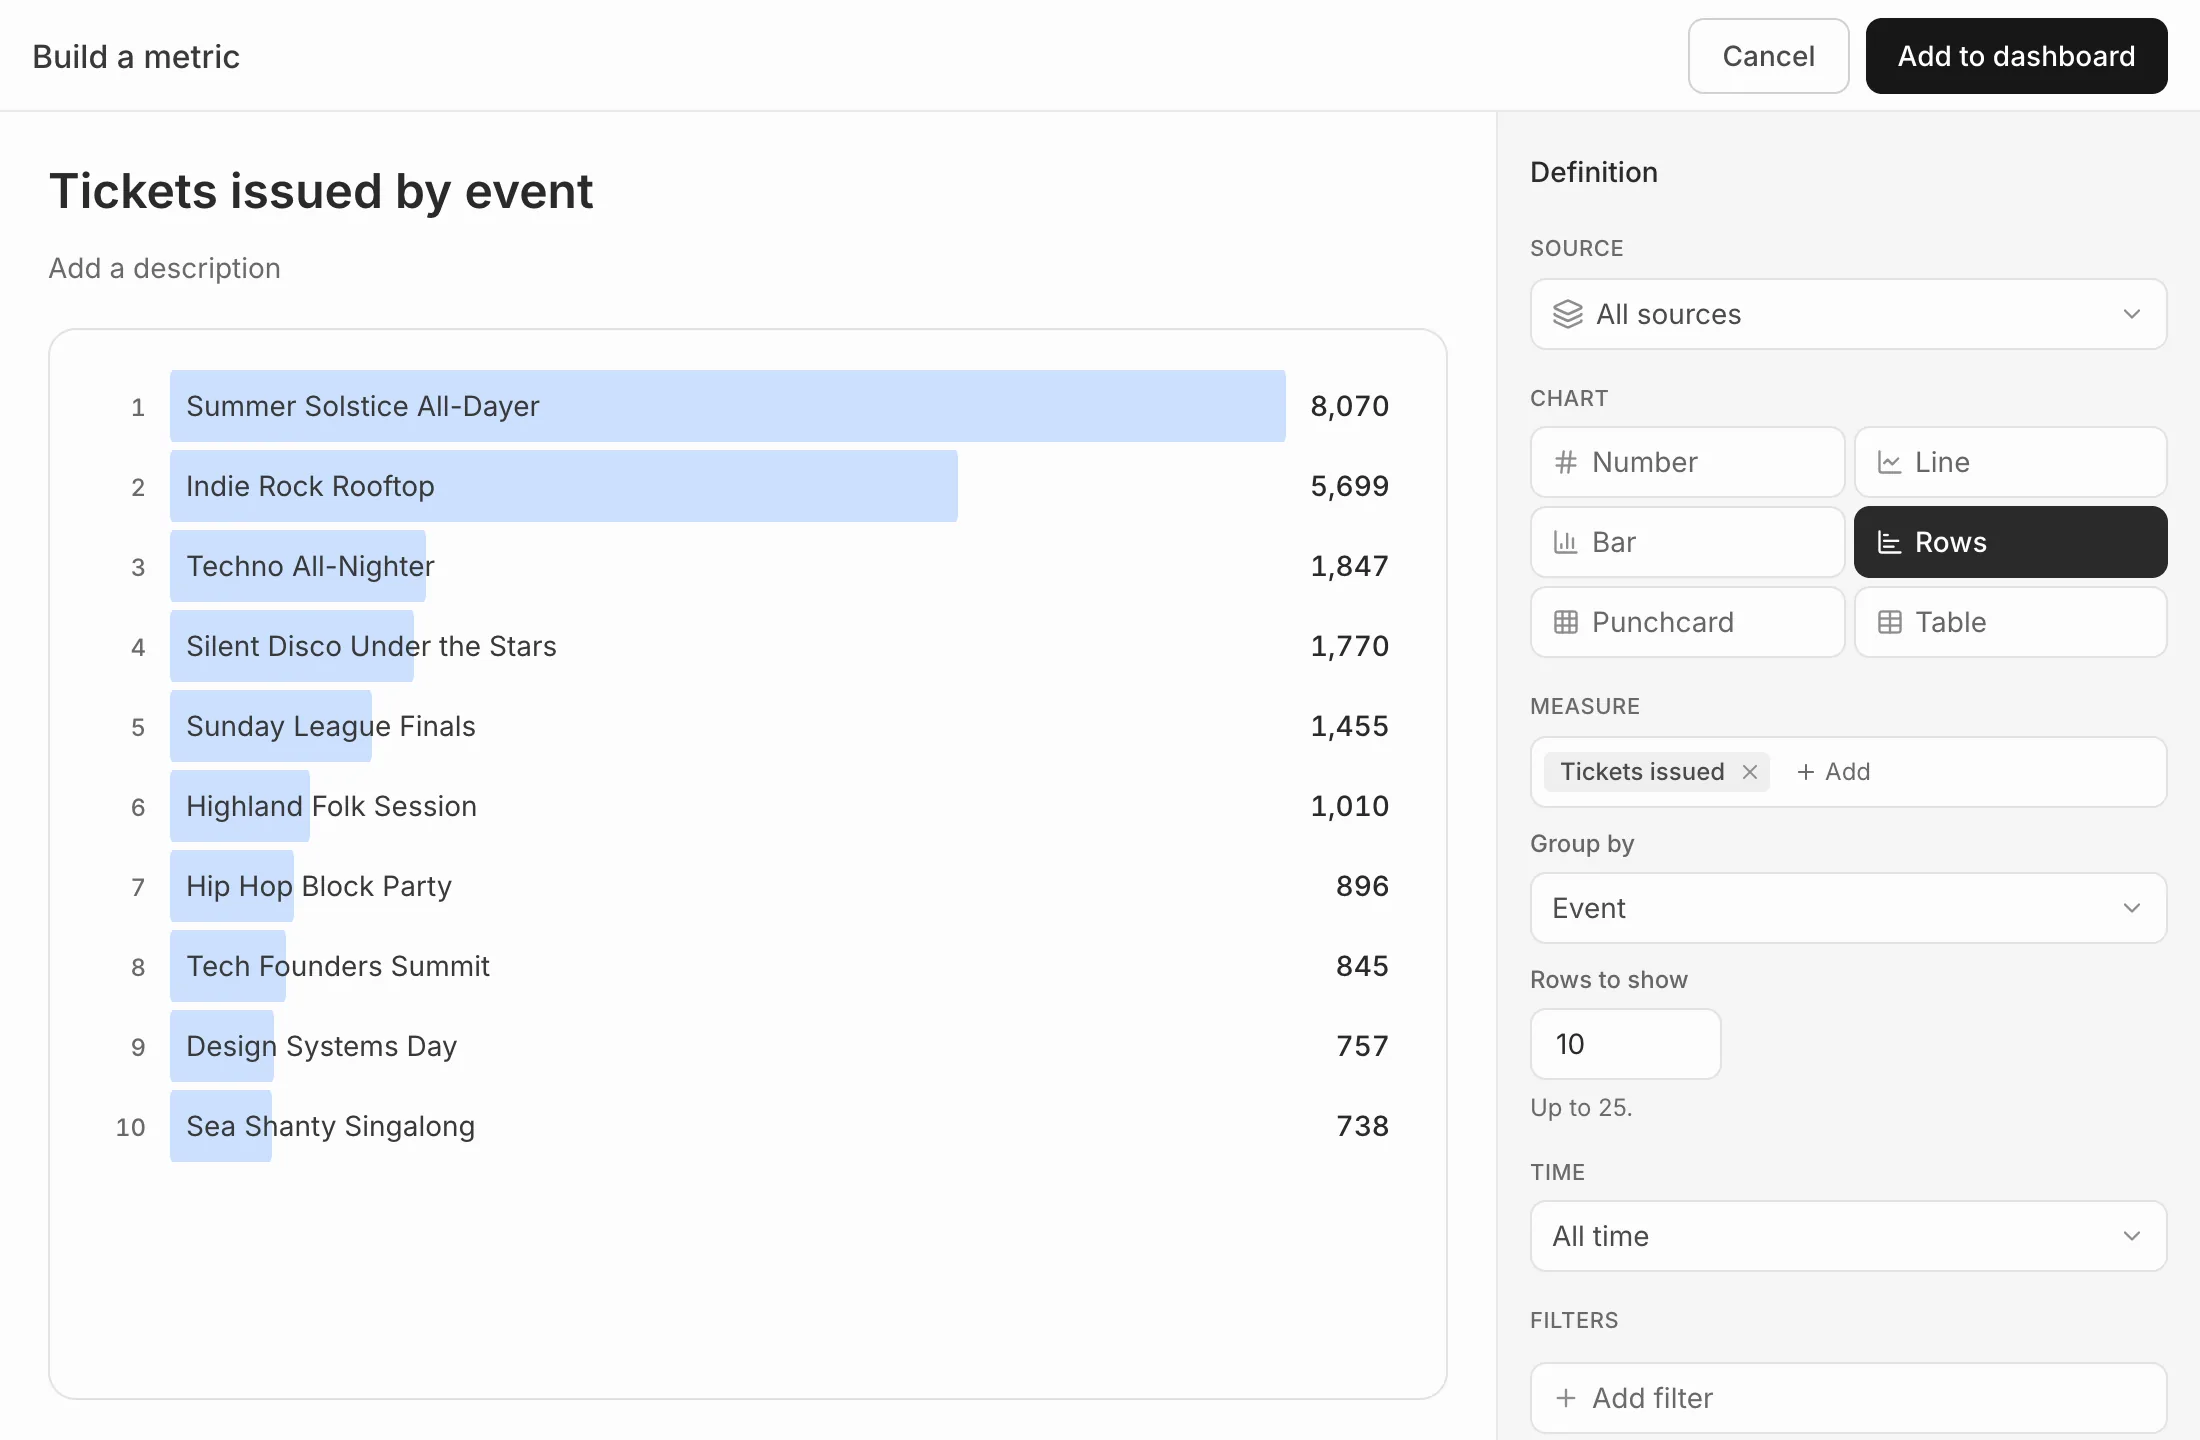
Choose what to measure
- Source: one ticketing platform, or All sources.
- Chart: a Number, Line, Bar, Rows, Punchcard or Table. Rows ranks a breakdown; a punchcard shows a metric by day of the week and hour of the day.
- Measure: what to count, such as tickets issued or net revenue. Some charts take more than one.
- Group by: split it, for example by event or ticket type.
Set the time
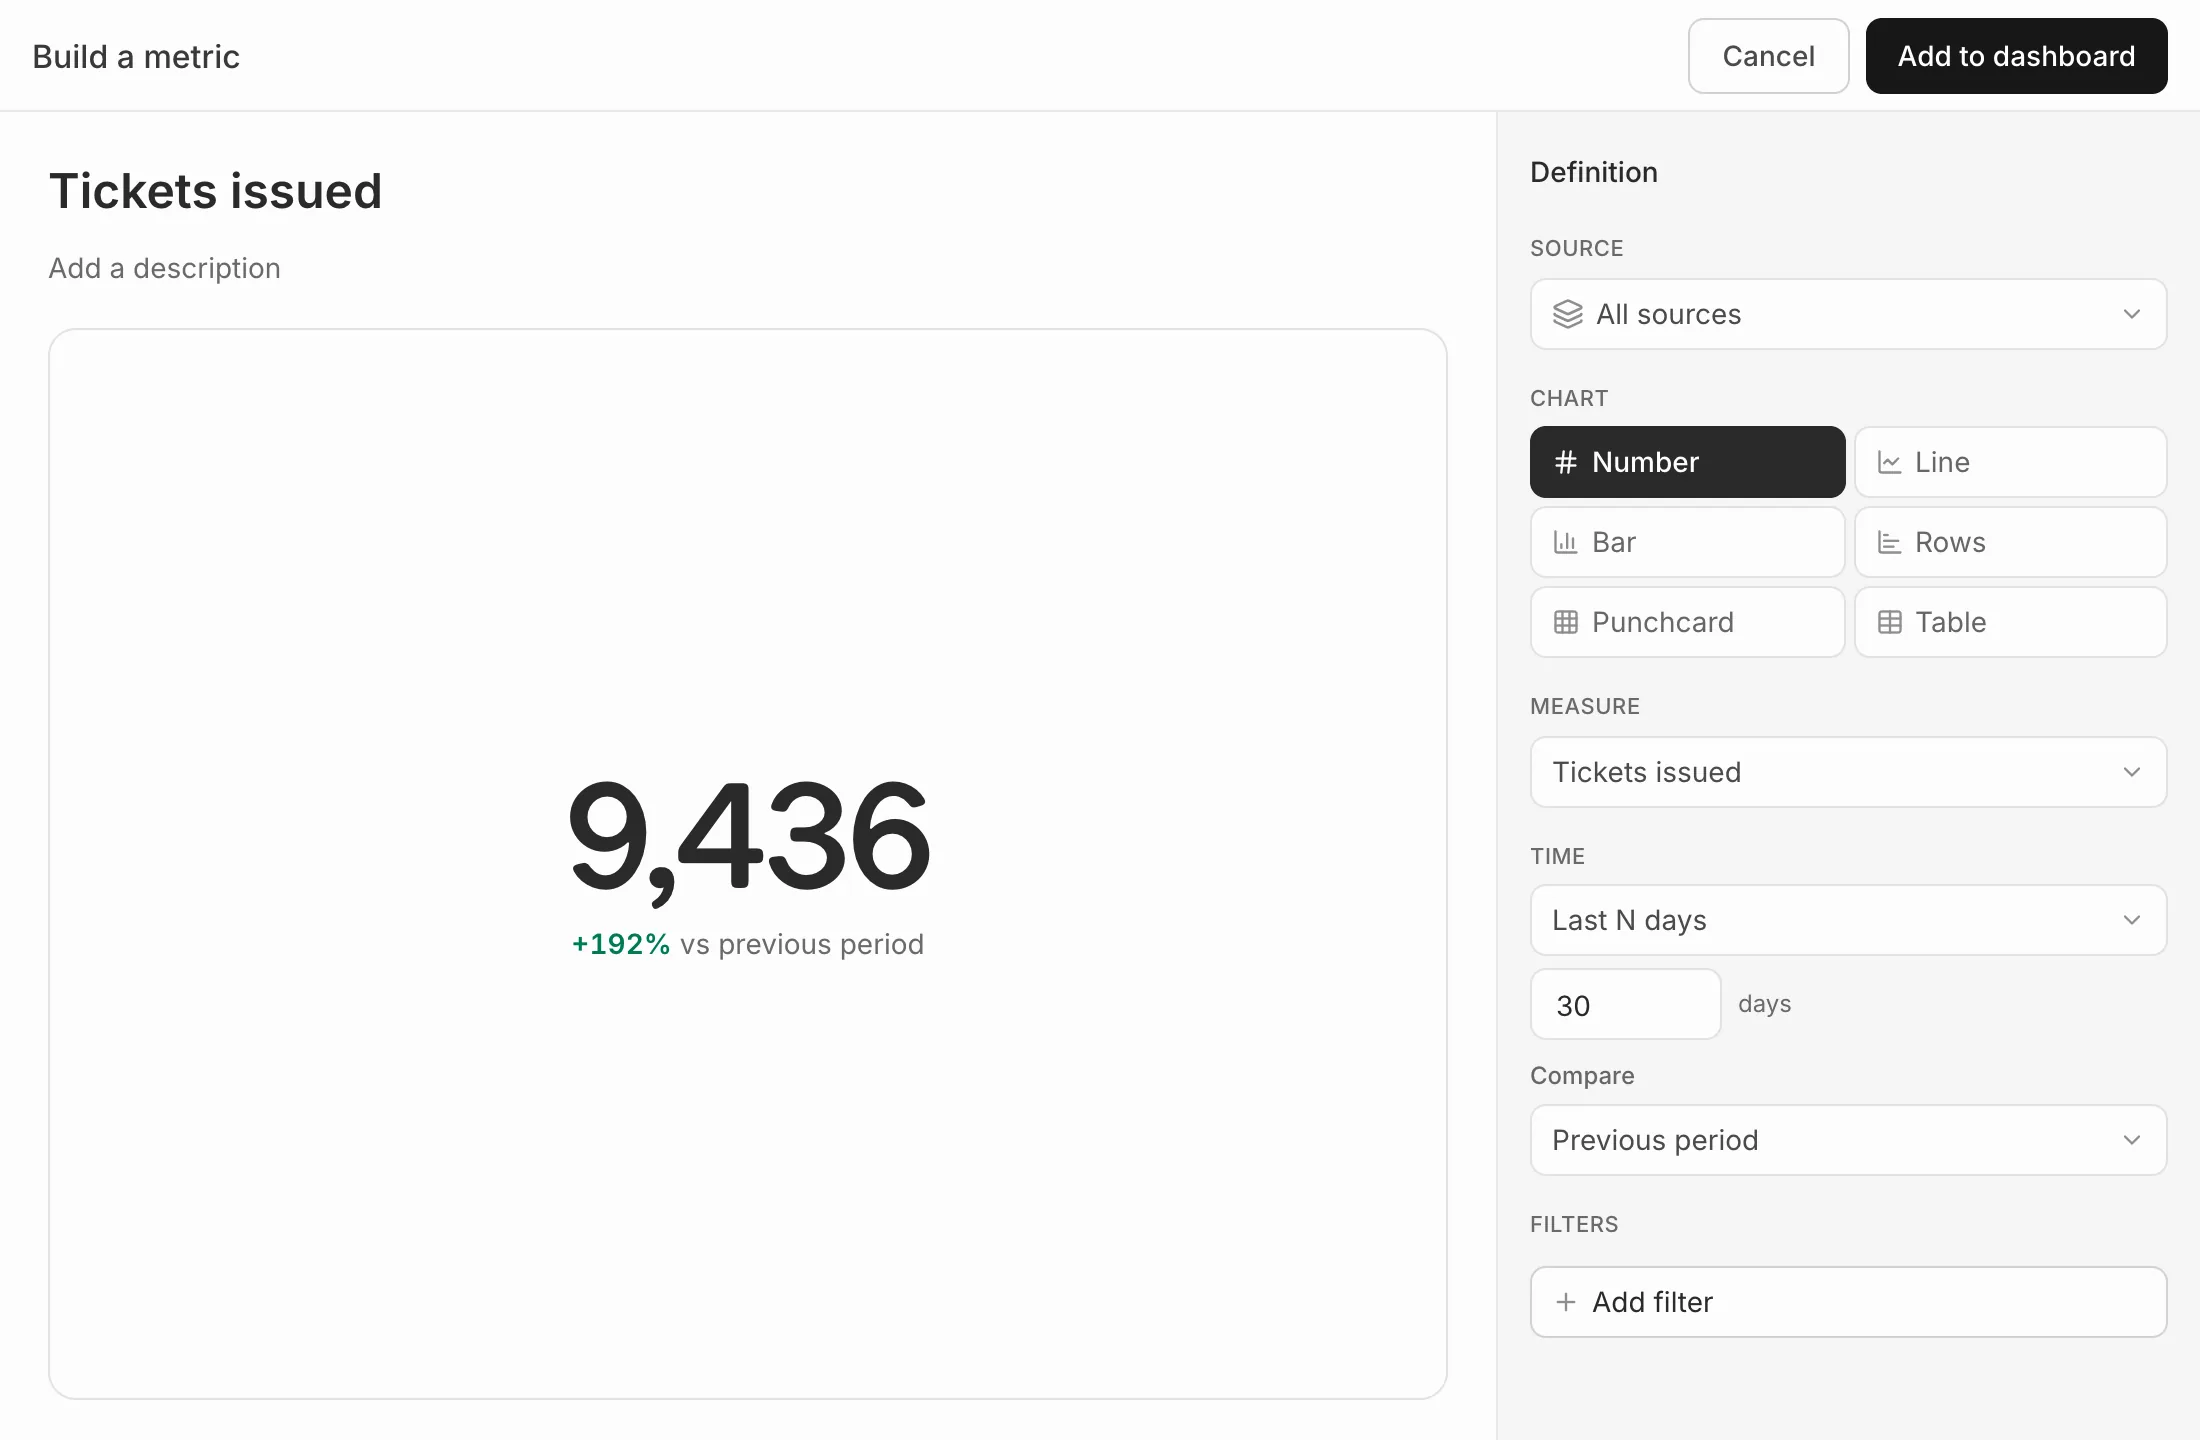
Under Time, choose All time, Last N days, Next N days or a Custom range. For a chart over time, pick the date to plot, such as the purchase date, and whether to show it by hour, day, week or month.
Compare sets a number beside the Previous period or the Same period last year.
Count only some sales
Under Filters, press Add filter, choose a field and a value: for example, ticket type is one of Early Bird and VIP.
Save it
Give it a name and press Add to dashboard. To use it on other dashboards and in reports, open the card’s menu and choose Save to your metrics.
To change it later, choose Edit from the card’s menu.
Editing a metric changes it everywhere it’s used.