Ask
- In the sidebar, press + beside Chats to start a new chat.
- Type your question into the box at the bottom and press Enter.
For example:
- Which events sold best last month?
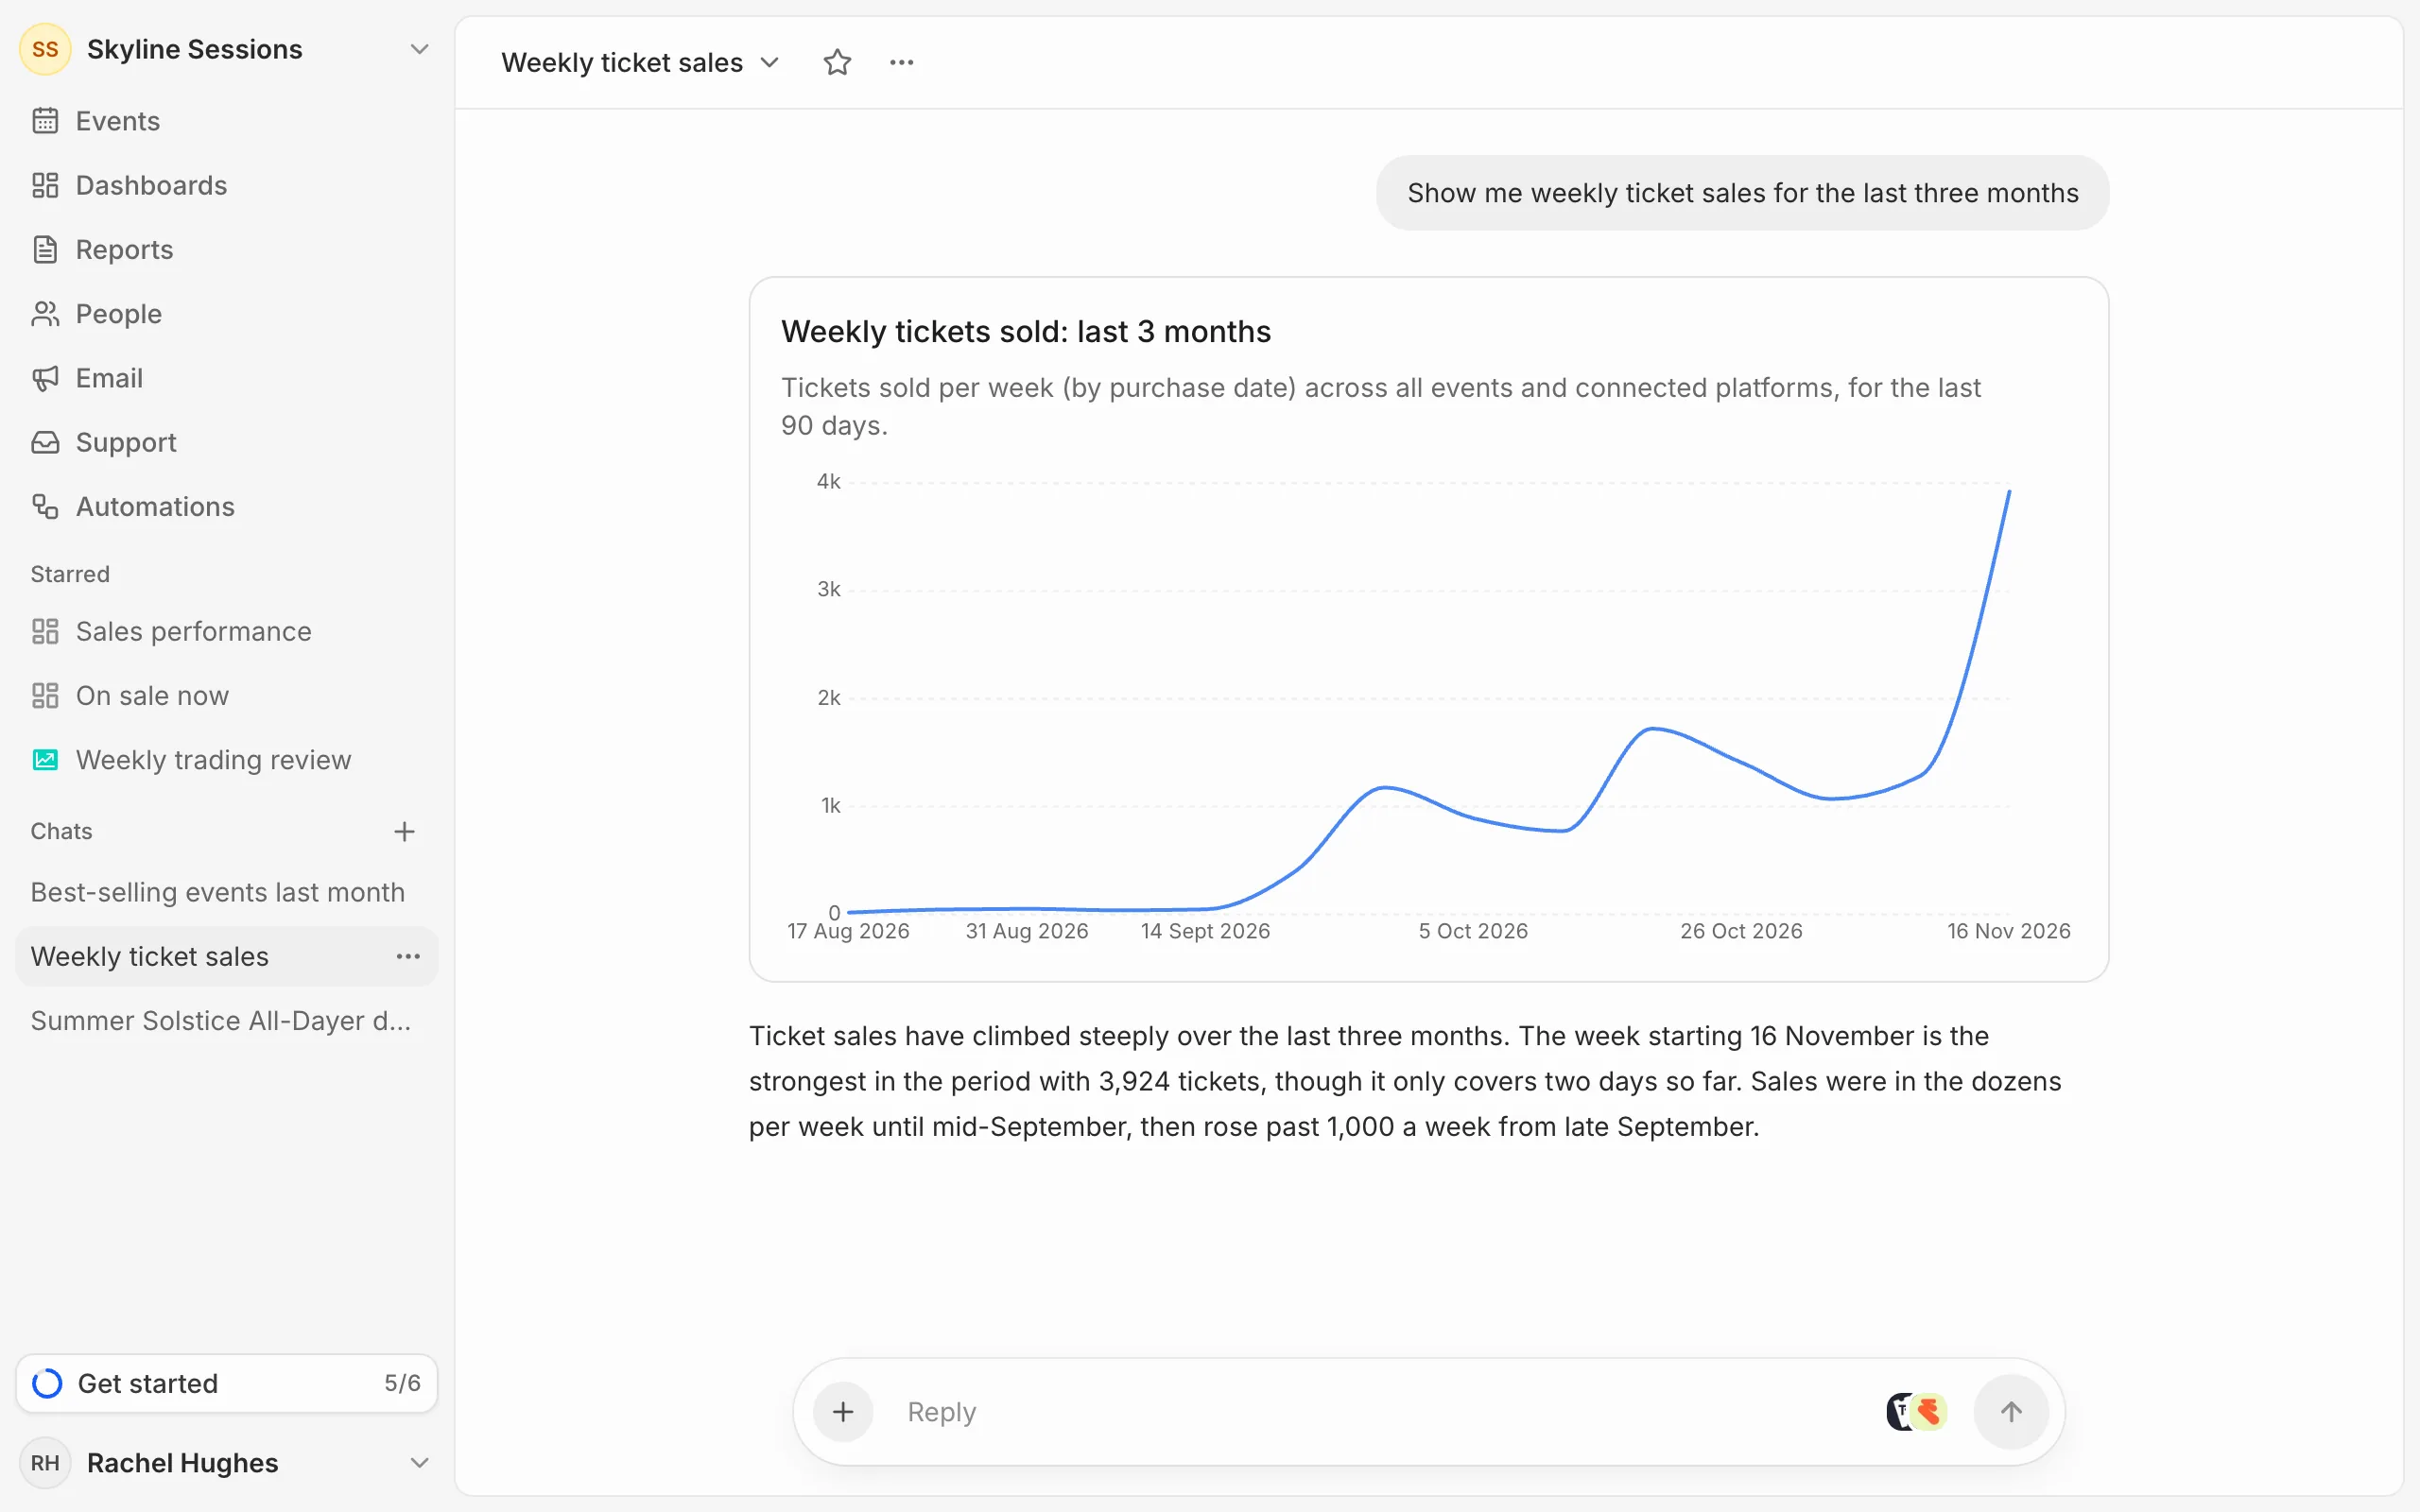
- Show me weekly ticket sales for the last three months.
- What’s our check-in rate for last month’s events?
- Who are my top 20 buyers by spend?
It answers in a few sentences, with a chart or table for each figure it looked up. It needs a connected ticketing platform to answer from.
Choose a ticketing platform
It answers from all your connected platforms at once. To ask about just one, choose the platform logos beside the question box and pick it.
Point it at a dashboard or report
Press + beside the question box, or type @, to attach a dashboard, report or metric. The assistant reads it with every question in that chat, so you can ask things like “why did this drop last week?”.
Follow up
Keep asking in the same chat to narrow an answer down or change its chart. Hover over a message to copy it, to Edit and resend your question, or to Regenerate the answer.
Check the answer
Like any AI, the assistant can get things wrong. Read the description under each chart to see exactly what it counted, and check figures you’ll report on against a dashboard.